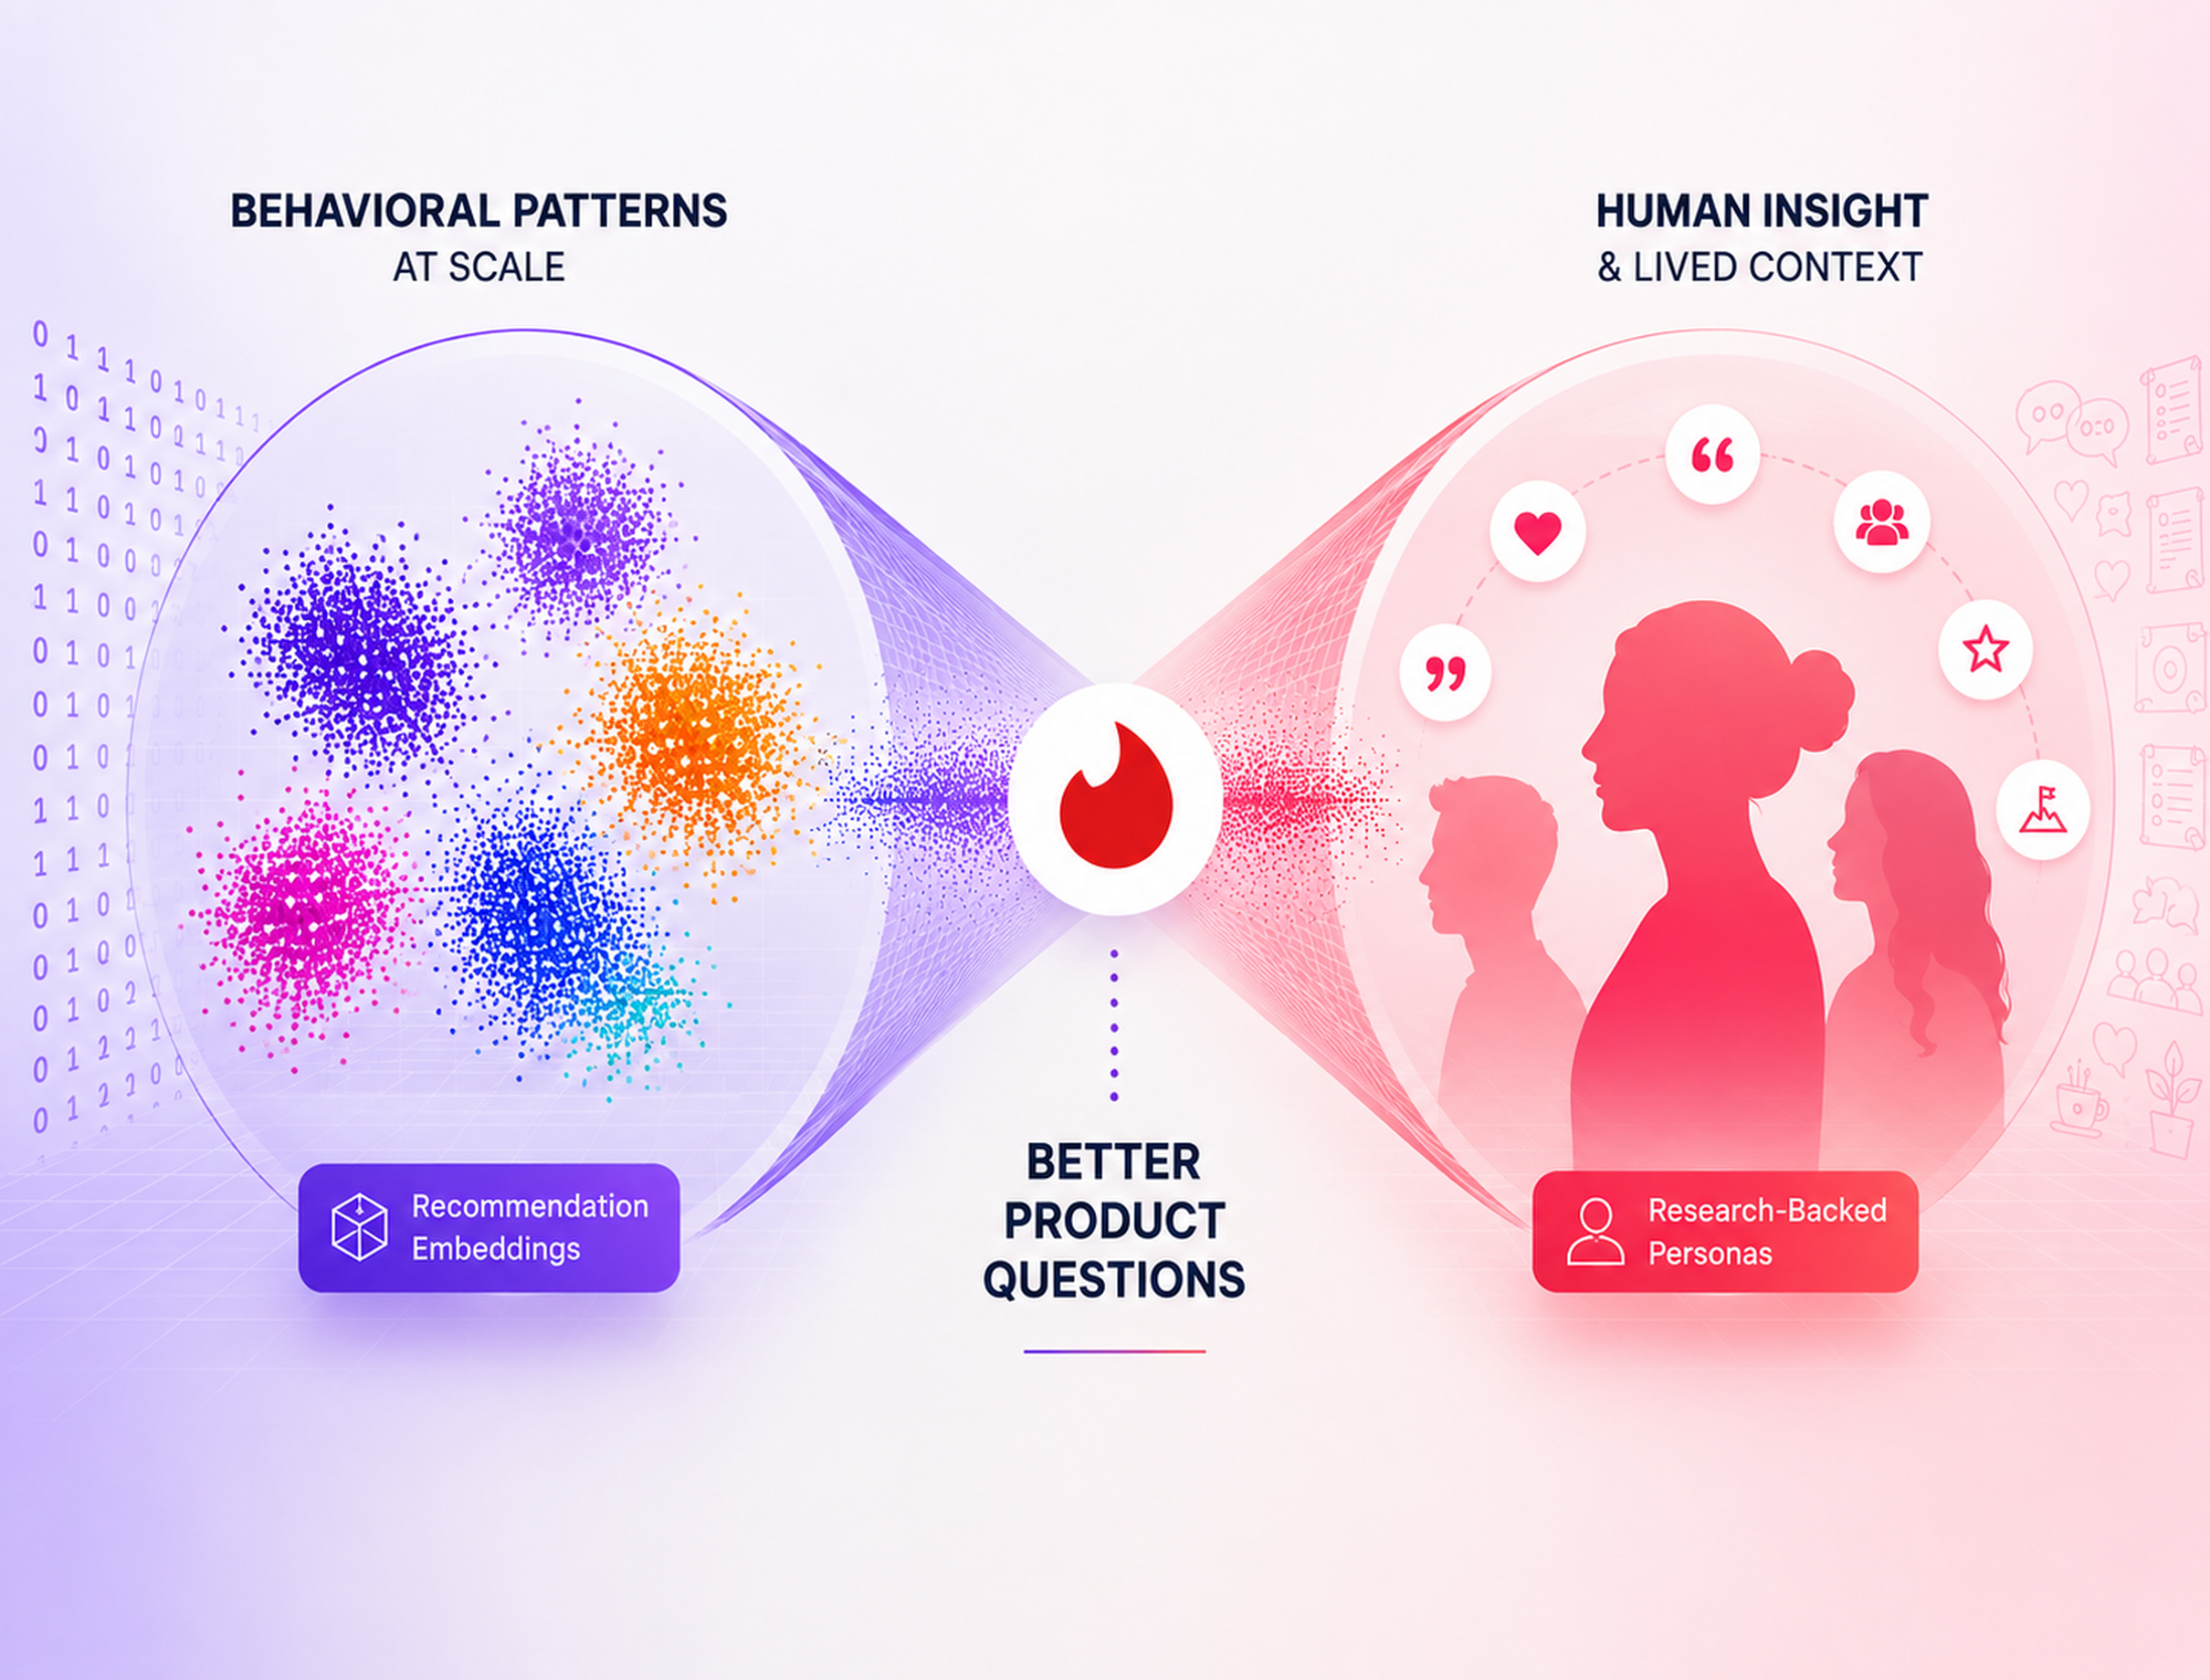

One of my favorite parts of working at Tinder® is AI Day, where we have the freedom to explore questions that would not normally be part of our sprint work. For one day, engineers step away from their roadmaps and investigate ideas outside their usual scope, ideas that might not belong on a backlog but could help us explore how AI might automate recurring work or teach us something valuable.
In the months leading up to AI Day, I kept returning to one question: could analyzing recommendation embeddings help us identify interpretable patterns in user behavior, estimate their prevalence within selected cohorts, and use those findings to ask better product questions?
Models developed by the Recommendations team learn high-dimensional representations, or embeddings, from profile and activity signals. These representations help our systems make recommendations at scale, but they are difficult to interpret directly. They contain rich information from the model’s perspective without providing a human-readable explanation of what that information represents.
My AI Day project focused on building a reusable way to make those embeddings interpretable by surfacing and describing the behavioral patterns they contained. The goal was to examine what the model had learned without treating those patterns as complete explanations of who users are, what they want, or why they behave as they do.
That gave embedding analysis a specific role alongside conventional product analytics and Consumer Research. Many product analyses begin with metrics or cohorts defined in advance. Embedding analysis instead begins with the multidimensional similarity structure the recommendation model has already learned, making it possible to surface combinations of signals we may not have known to look for and estimate how prevalent those patterns are within a selected cohort.
In the sections that follow, I explain how I made that structure inspectable, why I used K-means to partition a largely continuous embedding space, what one large cluster revealed, and how Consumer Research helped turn that finding into a better product question without overinterpreting it.
Two Ways of Understanding Users
At Tinder, the Consumer Research team develops research-backed personas using both quantitative segmentation and qualitative research. These personas synthesize daters’ motivations, needs, tensions, and life context, giving teams a shared language for thinking about whom they are building for.
The Recommendations team’s systems offer a very different lens. Users with embeddings that are closer together may appear similar from the model’s perspective, based on the signals the model has learned to use. That does not necessarily mean the people themselves are similar. Embeddings reflect selected patterns in profiles and activity, not the full complexity of a person’s identity, motivations, or experiences.
The two perspectives therefore provide different kinds of evidence. Embeddings can reveal aggregate behavioral structure at scale. Consumer Research can help explain the human context that may sit behind an observed pattern.
I started wondering what might happen if those perspectives could inform one another. To explore that possibility, I first needed to make the model’s representation interpretable enough to support product analysis.
Making Embeddings Inspectable
The first challenge was practical. Embeddings are a powerful component of recommendation models, but their high-dimensional values are not directly interpretable to people. Before I could use them to investigate product questions, I needed a way to identify patterns in the embedding space and describe those patterns using familiar product and behavioral metrics.
I built a reusable, parameterized Databricks notebook for exploring embedding spaces. The notebook samples embeddings produced from an existing recommendation model, optionally filters the sample to a target cohort, uses Principal Component Analysis as part of the dimensionality-reduction process, clusters users with K-means, visualizes the results with UMAP, and profiles each cluster using familiar product and behavioral features.
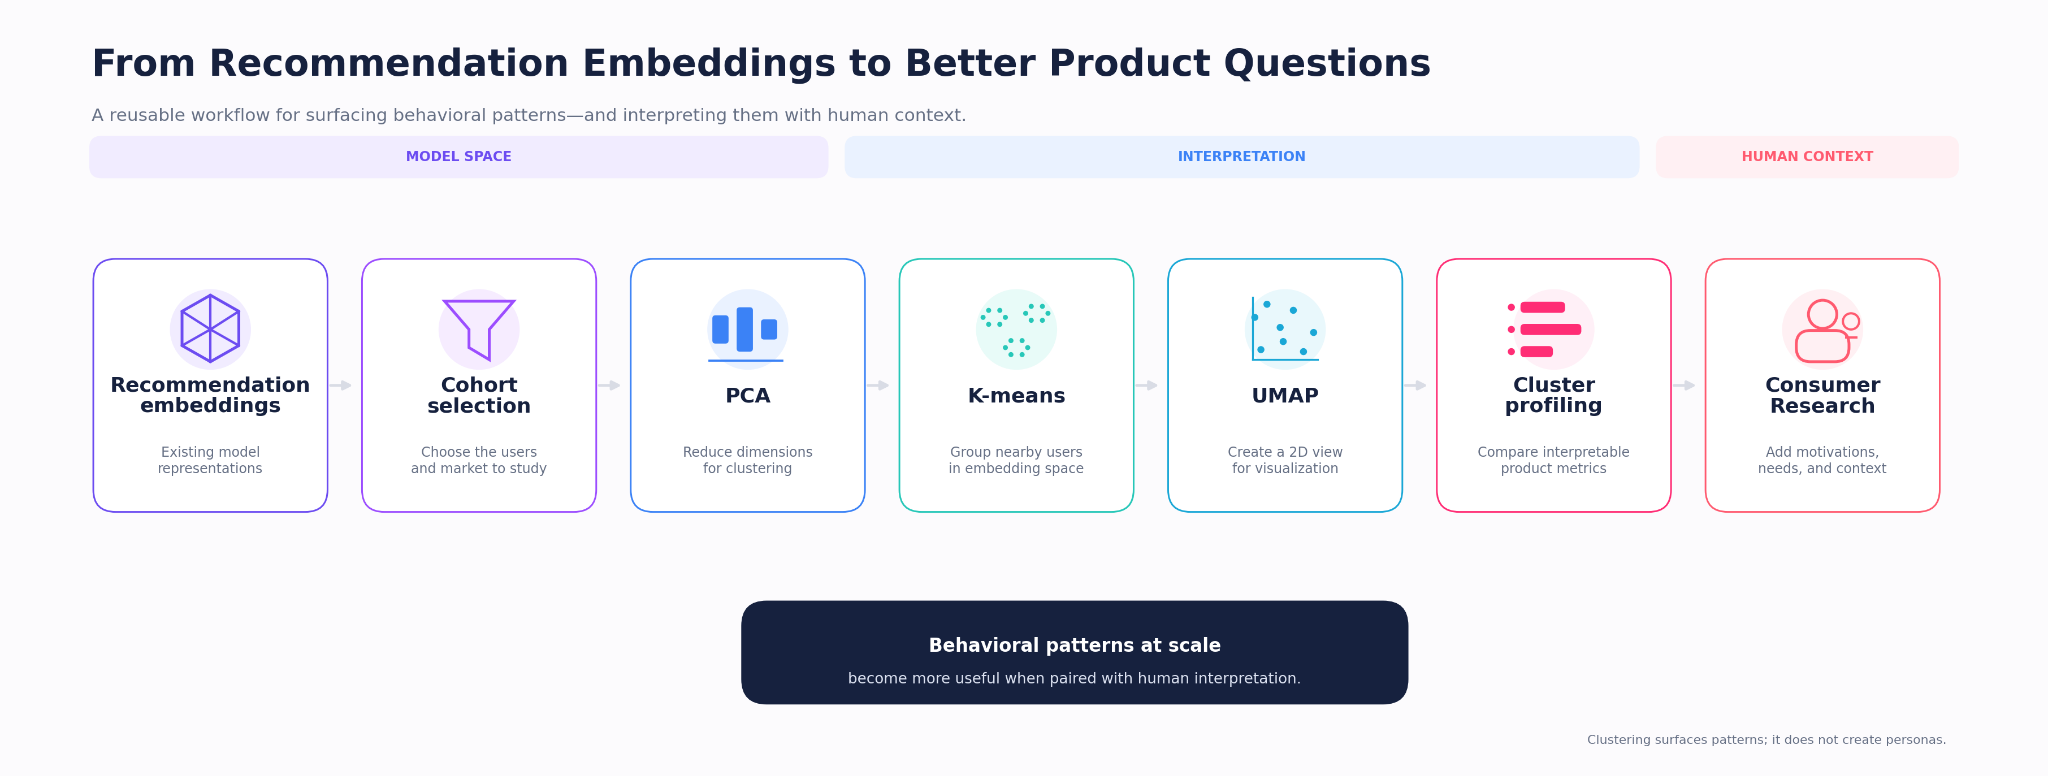
The cluster-profiling step was especially important. Embedding dimensions are not inherently meaningful to a person looking at them. Comparing clusters using interpretable metrics, such as profile completeness, engagement, messaging activity, and verification rate, made it possible to describe the aggregate behavioral patterns associated with each group. Because the notebook is parameterized, the workflow can be reused across different embeddings, cohorts, clustering configurations, and visualization settings.
Choosing a Clustering Strategy
Before settling on K-means, I experimented with HDBSCAN, a density-based clustering algorithm that can identify groups without requiring a predefined number of clusters. That made it a natural starting point: if the embedding space contained clearly separated, high-density groups, I wanted the algorithm to surface them rather than impose a partition in advance.
In practice, the embedding space behaved more like a broad continuum than a collection of isolated clusters. Across the parameter settings I tested, HDBSCAN tended toward one of two outcomes: it labeled most users as noise, or it grouped much of the sample into a single large cluster. This suggested that the structure in the embedding space was not well described as a small number of dense regions separated by clear boundaries.
Density-based clustering was not a good fit for the product question I wanted to investigate. My goal was to compare patterns across the entire selected cohort, not only within its densest regions. I therefore switched to K-means, which assigned every sampled user to one of a fixed number of clusters and gave me a consistent set of groups to profile using familiar product and behavioral metrics.
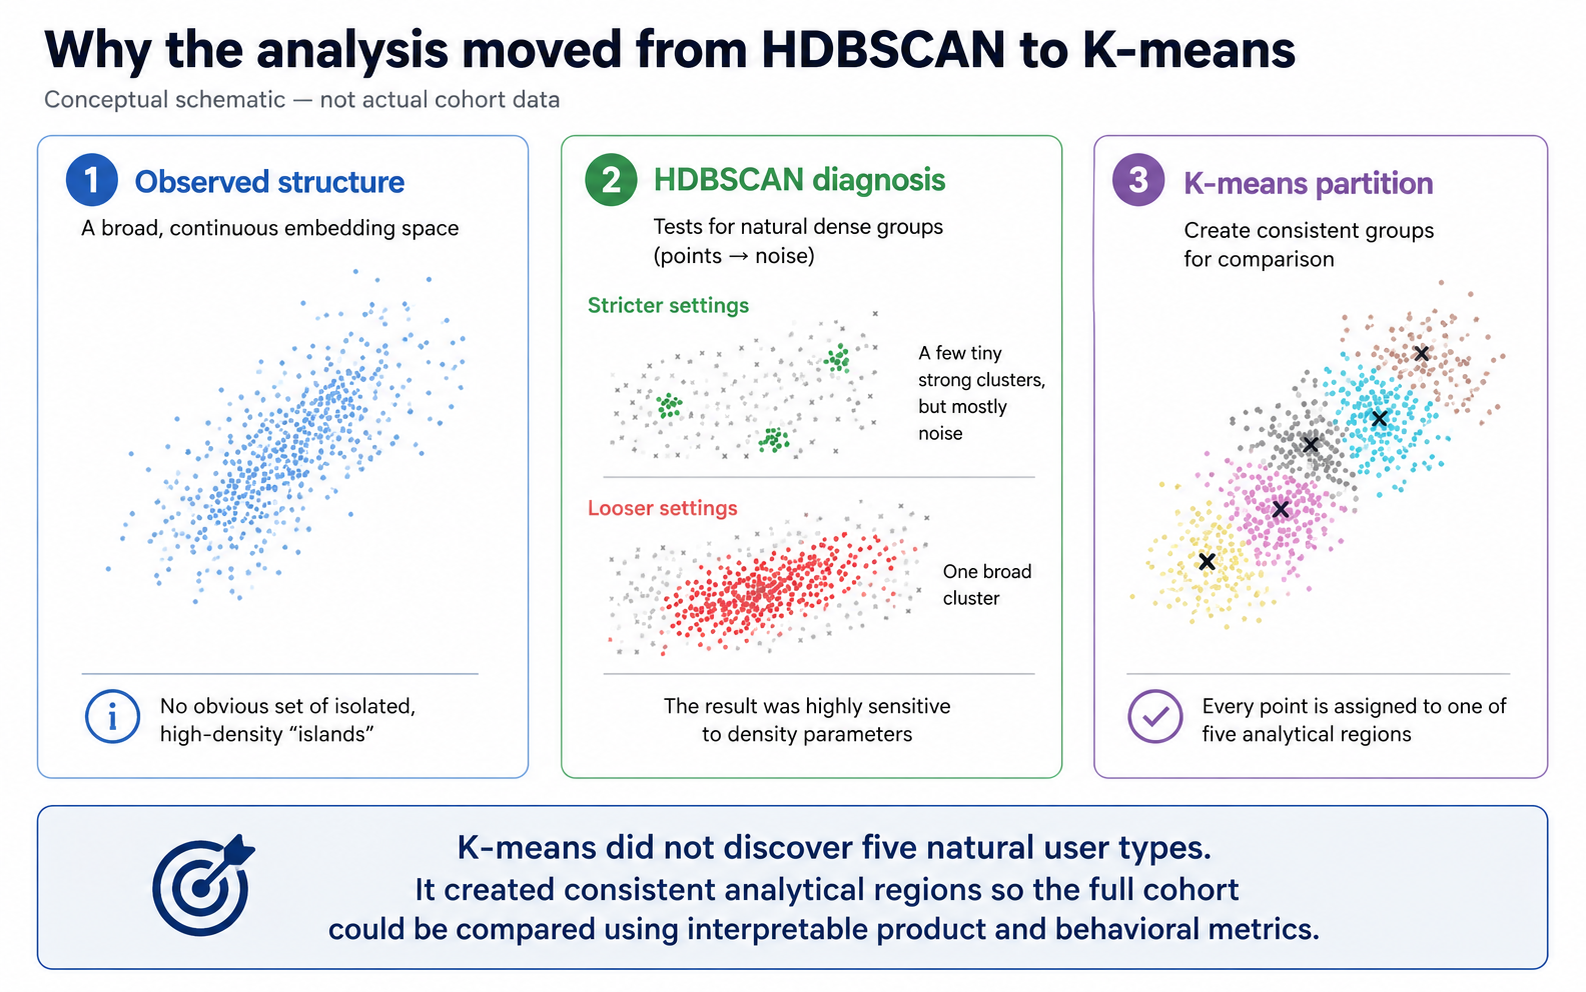
This choice came with an important tradeoff: K-means partitions the space whether or not natural, discrete user types exist. I therefore treated its clusters as analytical regions within a continuous embedding space, not as categories discovered in the population. For the analysis that follows, I chose five clusters as a manageable exploratory configuration and interpreted them through their relative feature profiles. With a practical way to partition and profile the embedding space, I could begin looking for behavioral patterns that were both substantial in scale and useful for generating product questions.
One Cluster Raised an Interesting Question
After experimenting with several embedding representations and cohorts, I focused on embeddings from more than 300,000 eligible U.S. Gen Z women ages 18-29. For this exploratory analysis, I configured K-means to produce five clusters and interpreted each group by comparing its relative feature profile rather than attaching meaning to its arbitrary cluster ID.
I then created working behavioral labels to summarize the primary signals associated with each cluster. These labels were human-authored descriptions of aggregate metrics, not user types produced by the clustering algorithm.
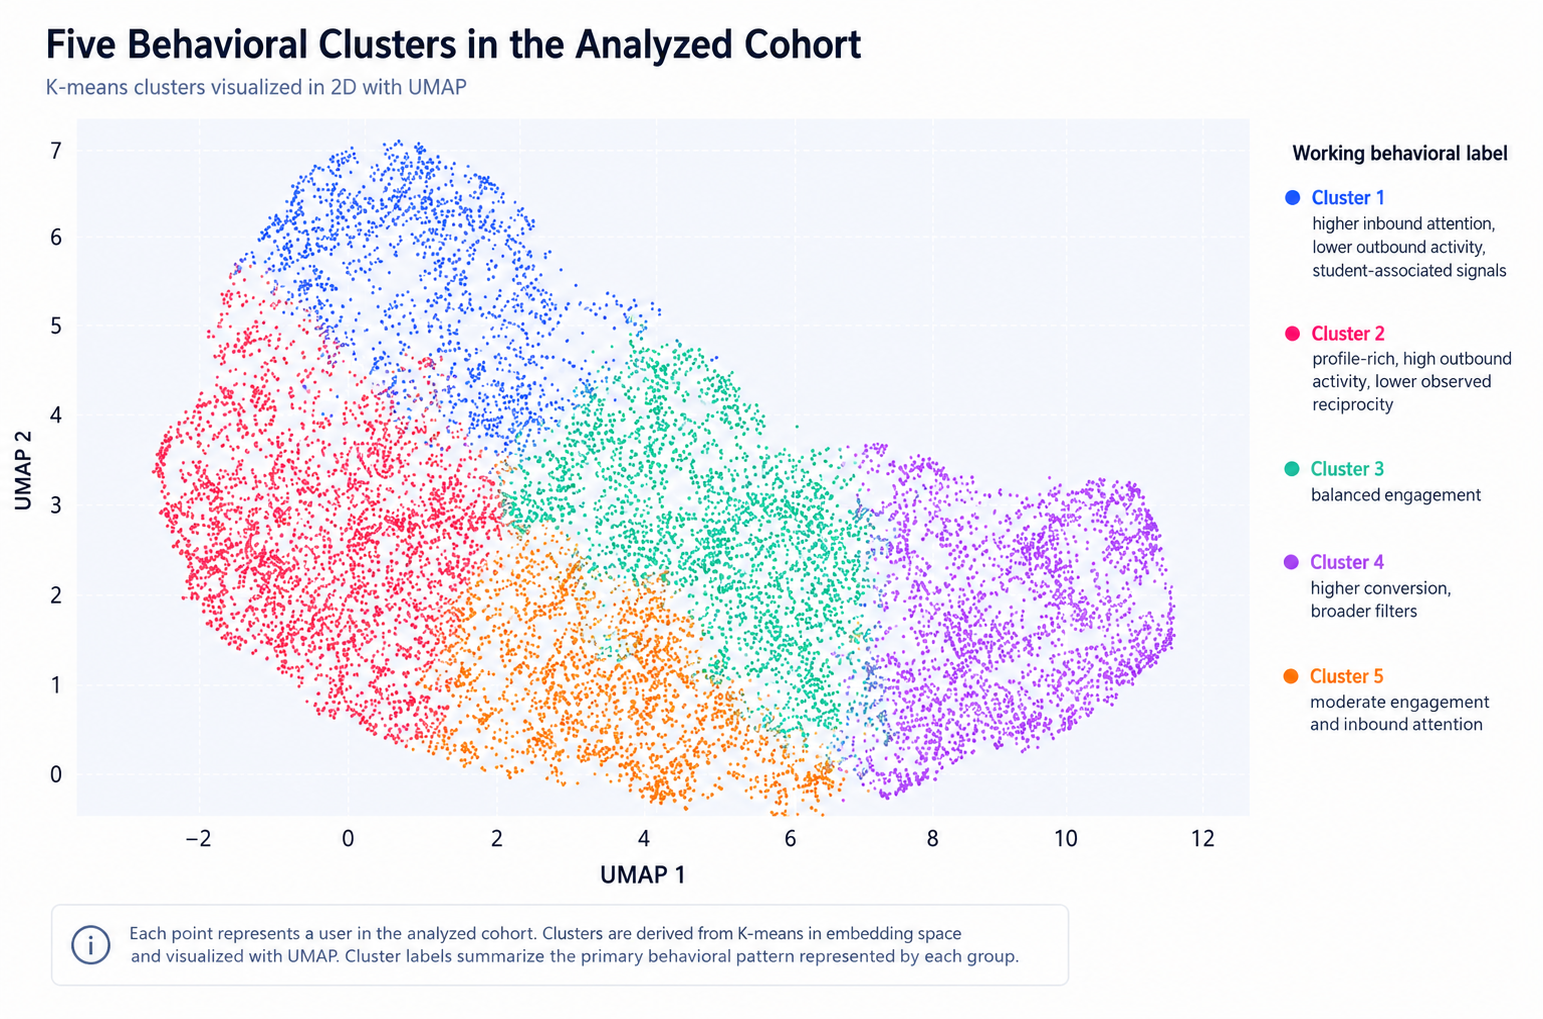
One cluster immediately stood out: it represented 25.7% of the analyzed cohort, making it the largest cluster in the analysis. It also had the lowest average distance to its cluster center, indicating lower within-cluster dispersion than the other groups under this representation and distance metric. In other words, its members occupied a comparatively compact region of the model’s embedding space.
The cluster showed stronger signals of profile richness and outbound activity. Its users had longer bios, more photos, higher verification and discoverability rates, greater Spotify anthem adoption, and more likes sent.
At the same time, the cluster showed weaker observed inbound and downstream outcomes across the metrics I examined. Its users received fewer likes and swipes and had lower levels of conversations and messages received.
Together, those features revealed an interesting tension: high profile completion and outbound engagement alongside weaker inbound engagement from other users.
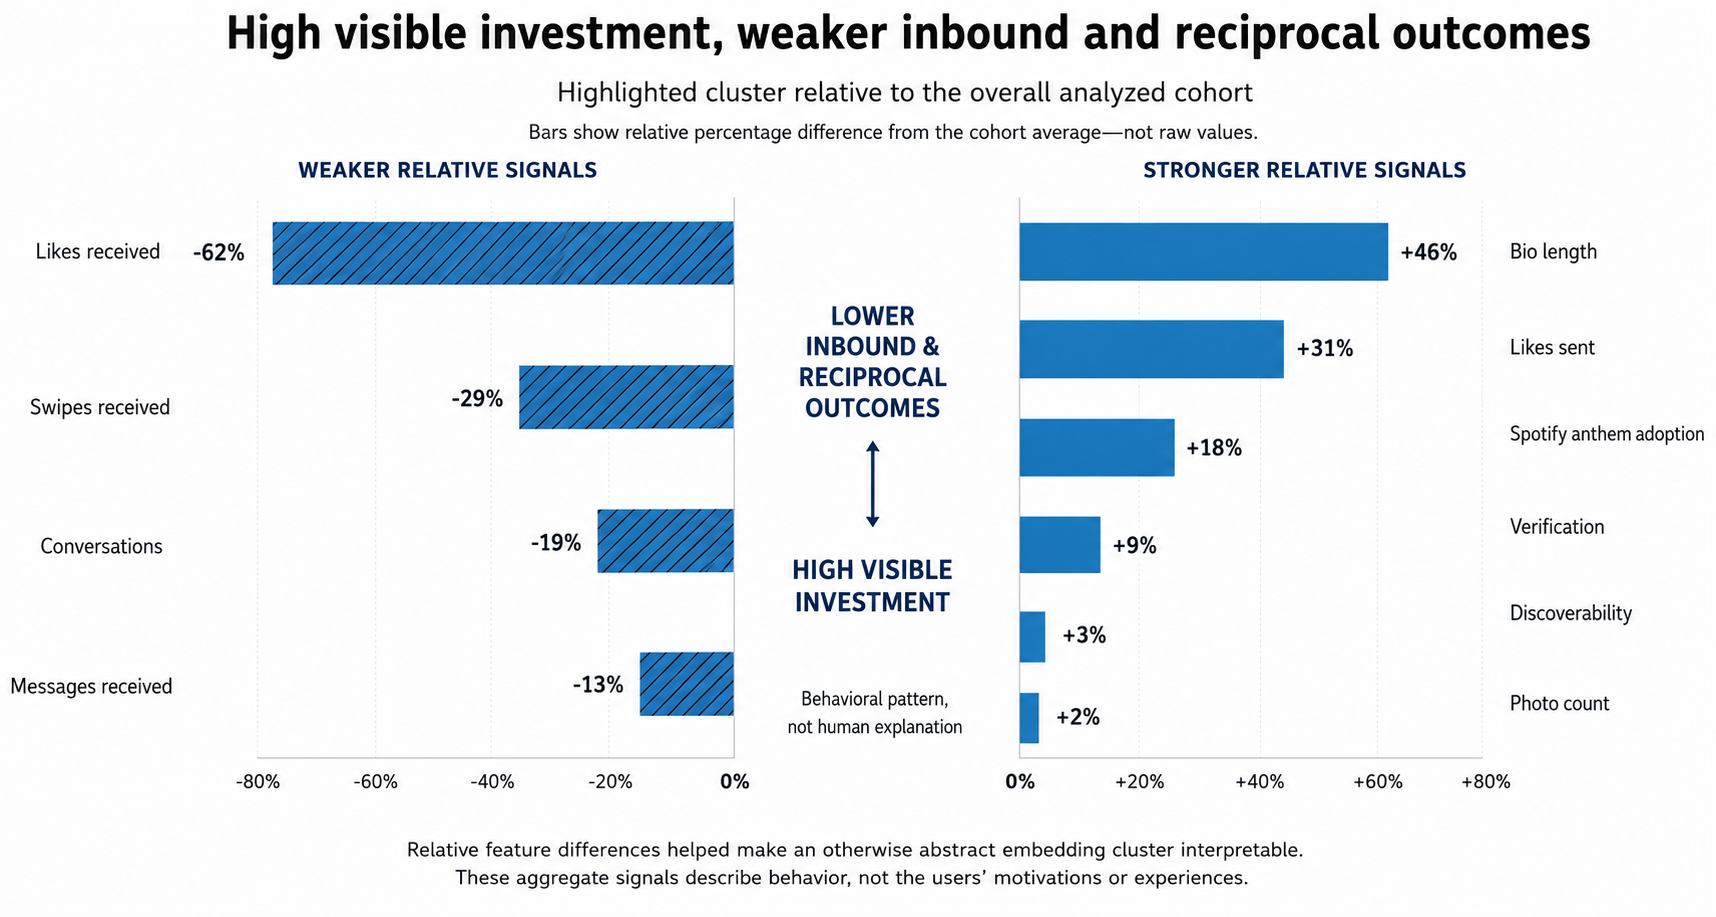
I gave the group the working label “profile-rich, high-outbound, lower-reciprocity cluster.” The pattern seemed worth understanding more deeply. These users appeared to be investing visibly in the dating experience while receiving weaker observed outcomes on the metrics examined, but the data could not tell me why.
That observation raised a new question: was I looking only at an interesting behavioral cluster, or did the pattern overlap with something Consumer Research had already observed?
A Behavioral Echo of Shelby
I shared the analysis with Tinder’s Consumer Research team and compared the results with the team’s existing personas.
Consumer Research recognized an echo of Shelby, Tinder’s Sincere Seeker persona: someone who continues showing up and investing in the dating experience despite receiving weaker outcomes.
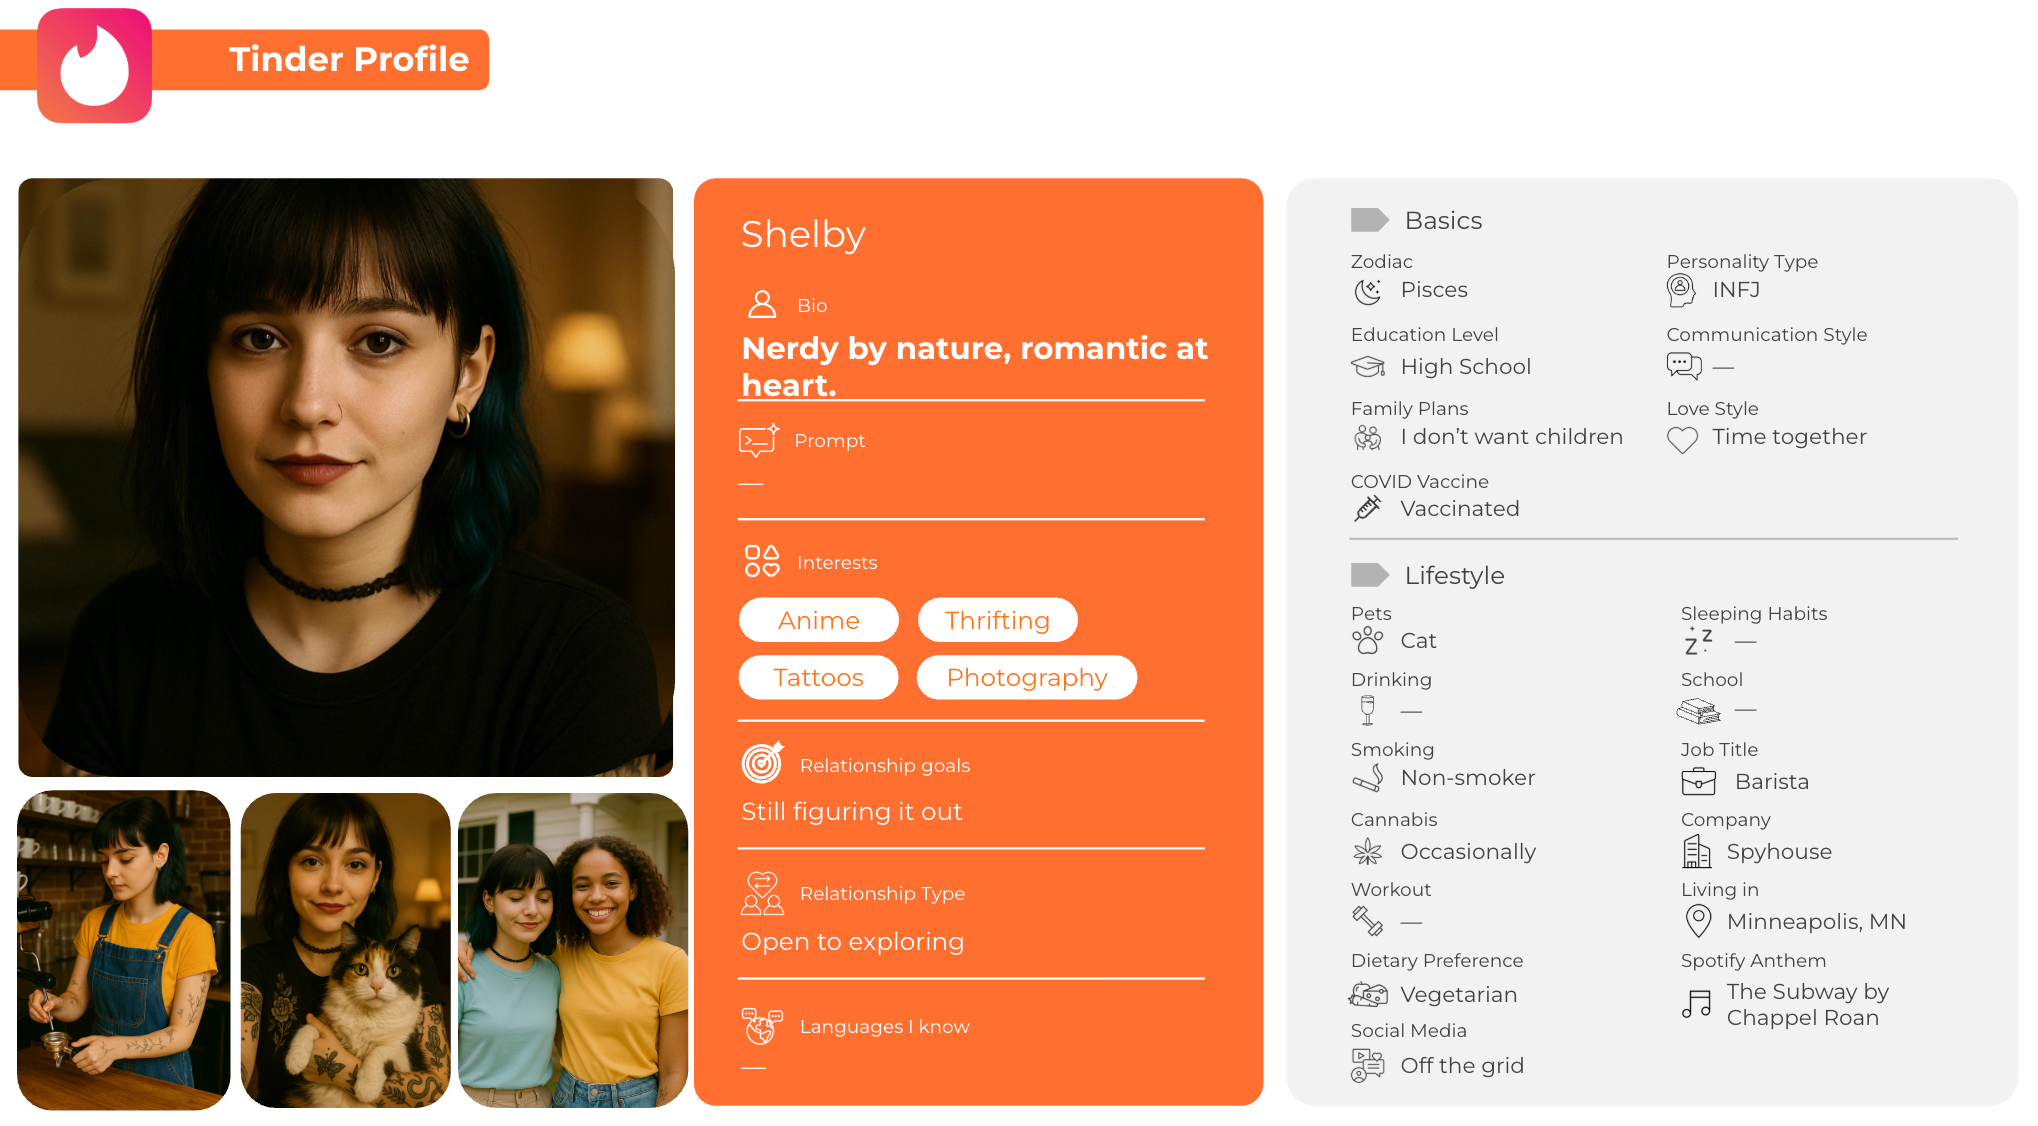
That comparison changed how I understood the result, but it was important not to take it too far.
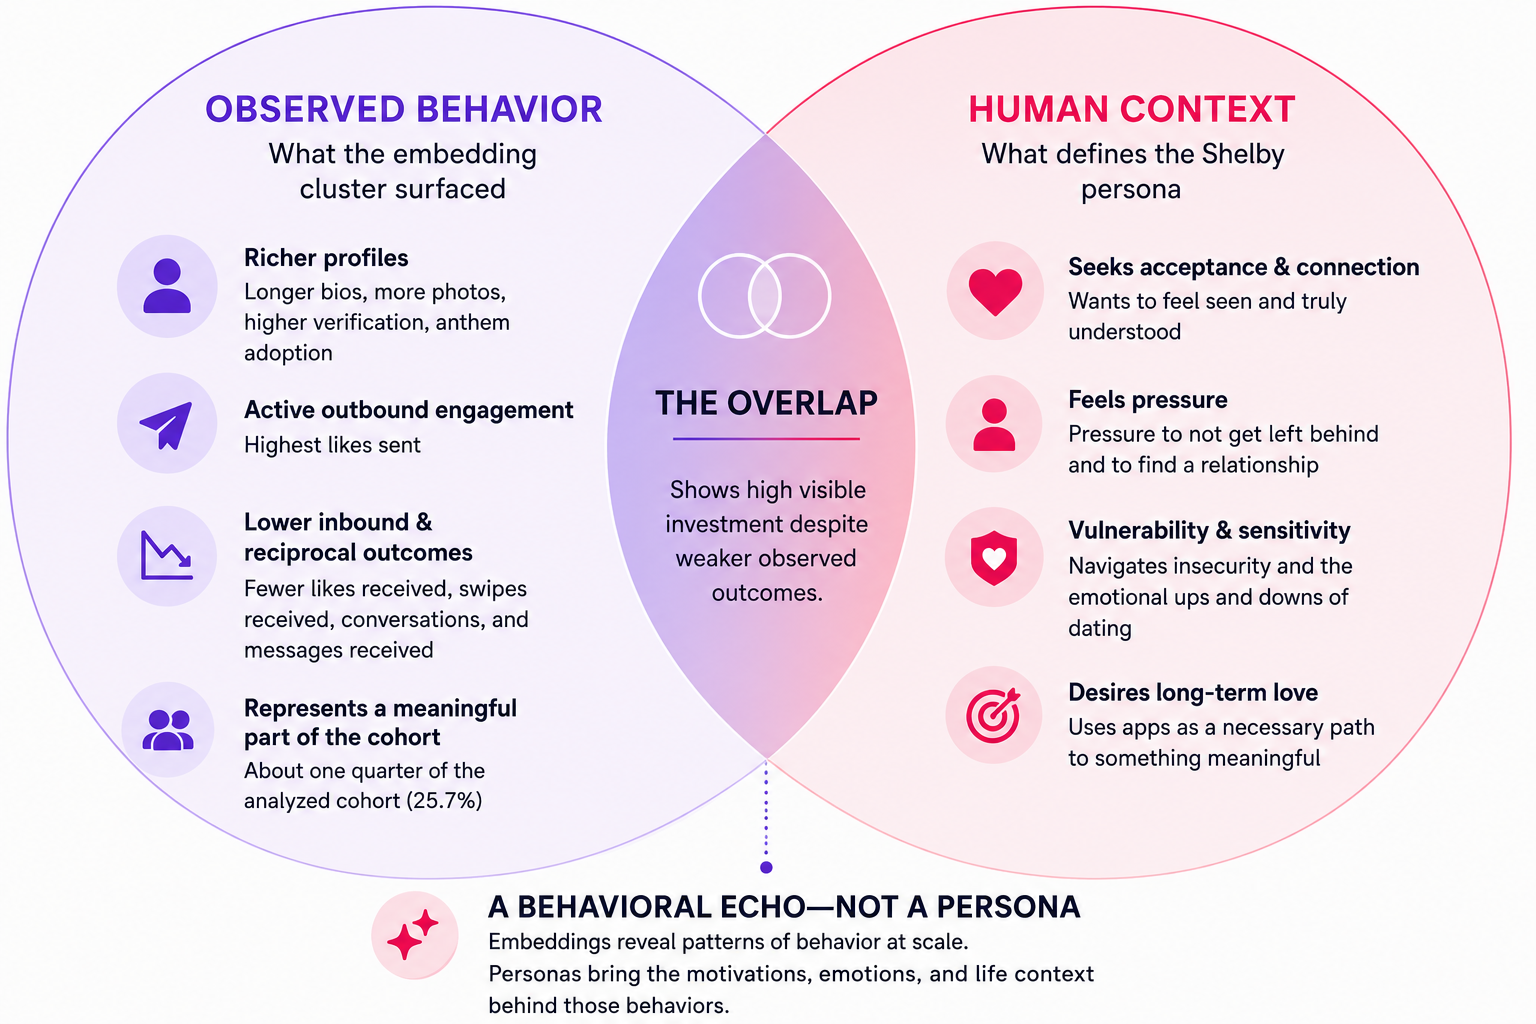
The cluster did not identify Shelby or describe itself. It could not tell me whether its members felt pressure, struggled with vulnerability, wanted a serious relationship, or were seeking acceptance. Those motivations and emotional experiences come from the research that defines the persona; they were not produced by the embedding analysis.
Instead, the analysis had surfaced an aggregate behavioral pattern that overlapped with one observable aspect of Shelby’s experience: strong visible investment despite weaker observed outcomes.
What the Analysis Establishes and What It Does Not
This was an exploratory analysis using embeddings from one recommendation model, one selected cohort, and one clustering configuration.
The resulting groups depend on the embedding representation, the cohort definition, the features used to profile the clusters, the dimensionality-reduction choices, the clustering algorithm, and the number of clusters. Changing any of those decisions could produce different results.
The UMAP projection also provides a simplified, two-dimensional view of a much higher-dimensional representation. It is useful for inspection and communication, but the visible shapes and boundaries should not be interpreted as proof that five natural or universal categories of daters exist.
The benefit was not assigning Shelby, or any other persona, to individual daters. It was creating a way to connect research-backed hypotheses with a measurable behavioral cohort inside the recommendation system.
That cohort could now support more focused questions. How does this group experience recommendations? Do its observed outcomes persist over time? How does it respond to different product experiences? Which parts of the pattern are associated with user choices, and which may be associated with the system itself?
The embeddings did not answer those questions. They helped us identify where to begin asking them.
A Framework for Continued Learning
Embedding analysis could help identify aggregate behavioral patterns and estimate their prevalence within selected cohorts. Consumer Research could add context, challenge assumptions, and help turn those patterns into questions about motivations and experiences. Product teams could translate the resulting insights into hypotheses and experiments. Over time, we could observe whether the behavioral patterns change and whether product interventions affect different groups in different ways.
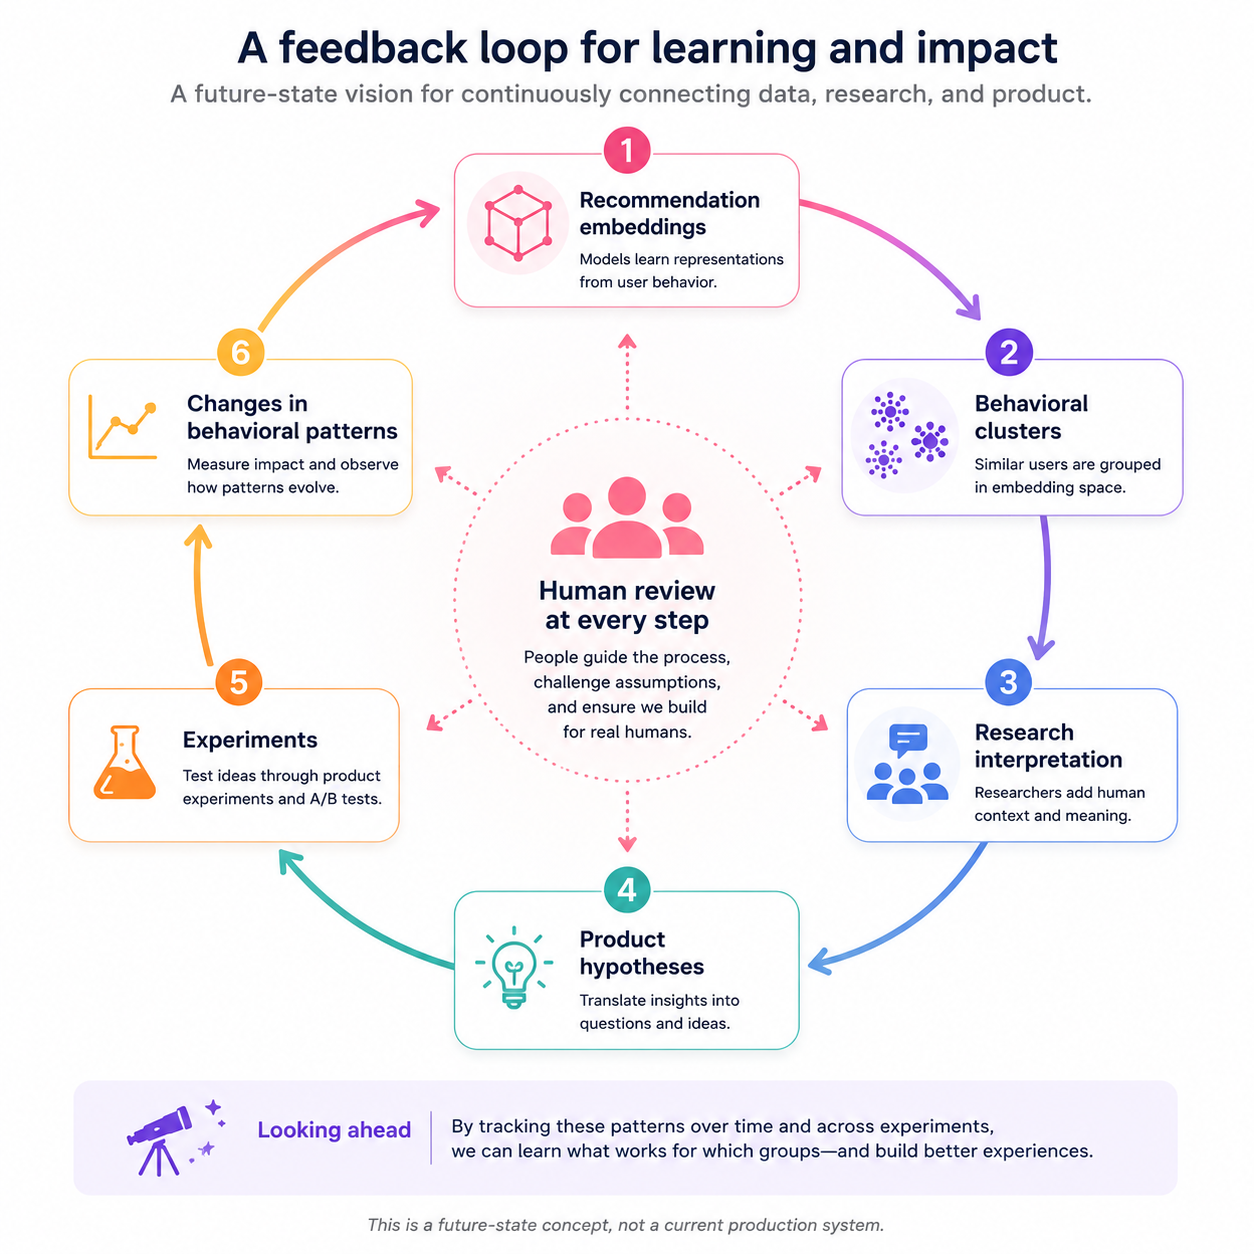
The project’s immediate outcomes were a reusable analysis workflow, a more concrete way for the Recommendations and Consumer Research teams to collaborate, and a measurable cohort that could support focused follow-up research. Next steps include testing whether the pattern persists across samples, model representations, and clustering choices; examining how it changes over time; and using it to inform carefully designed research studies or product experiments.
The Broader Lesson
Recommendation embeddings were built to improve recommendations, not to explain people. Making them inspectable gave me a way to surface behavioral patterns at scale and ask better product questions. Consumer Research provided the human context needed to interpret those patterns, and an important guardrail against treating them as complete answers. The most valuable outcome was a better bridge between two ways of learning about users: one behavioral and scalable, the other human and contextual.
That is what I value most about AI Day: it creates room to think differently about both the tools and data we already have, and the opportunity to discover new possibilities because of them.